
WIU COVID-19 Dashboard & Map Adds New Features
April 30, 2020
![[Download Print-Quality Image]](http://www.wiu.edu/images/news/17186/17186_9795_1.jpg)
MACOMB, IL – The statewide COVID-19 web map and dashboard launched in mid-March by the Western Illinois University GIS Center, in cooperation with the Department of Earth, Atmospheric and Geographic Information Sciences (EAGIS) and the Illinois GIS Association (ILGISA), has had over 700,000 views and has become the "official" public site in Illinois, shared by state and federal agencies, as well as numerous news outlets throughout Illinois.
The dashboard initially began with map layers for Illinois and surrounding counties, and was quickly expanded to include every county and state in the U.S. for comparative purposes. Initially, indicator panels were included showing active cases and deaths for Illinois only.
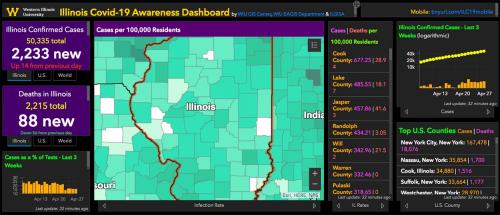
"As the dashboard grew in popularity and the map layers were expanded nationwide, we added nationwide and global statistics, as well as additional map views," explained WIU GIS Center Director and ILGISA President Chad Sperry. "The additional map views include rate of active cases, rate of death, links for additional resources and county level info-graphics, which contain detailed demographic data at a local level."
According to Christopher Sutton, EAGIS cartography and GIS professor, as data related to COVID-19 has become more plentiful, the WIU team has adapted the dashboard to account for new and better information. A recent update to the main map includes showing infection rates, which gives users an idea of rates in those smaller counties outside of Cook County.
The team will further refine the map as the pandemic continues. By using a web environment, the map can be rapidly distributed and users can pan and zoom around the map to focus on particular areas of the map.
"One of the strengths of the dashboard is its interactivity. We have several maps, tables and graphs that allow users to view COVID-19 data in multiple ways. While the intent of the dashboard has been to focus on Illinois, we built it to show national data as well, and we've received comments from persons throughout the United States who refer to the dashboard," Sutton pointed out.
Data at the county level are reported by the Illinois Department of Public Health and respective agencies in states bordering Illinois. The map is updated once a day as the IDPH and other agencies release official reports. While the map data may lag slightly behind cases that are reported by news outlets, the information presented still remains relatively current.
"The dashboard showcases the power of GIS and the ability to visualize complex data in the form of maps, tables and charts," Sperry added.
To view the map, visit wiu.edu/illinoiscovidmap/.
Posted By: University Communications (U-Communications@wiu.edu)
Office of University Communications & Marketing
Connect with us: