
Assessment, Accreditation and Strategic Planning
National Survey of Student Engagement - 2010 Campus Results
The National Survey of Student Engagement (NSSE) evaluates the
effectiveness of productive student engagement each year by surveying
college freshmen and seniors. The NSSE results a summarized across five
nationally recognized effective educational practice benchmarks: Level
of Academic Challenge, Active & Collaborative Learning,
Student-Faculty Interaction, Enriching Educational Experiences, and
Supportive Campus Environment. In Spring 2010, more than 393,000
students from among 595 colleges and universities participated in NSSE.
Data for Western’s 2010 NSSE results are based on the
participation of the 16% of our freshmen and 23% of our seniors who
elected to participate in the online national survey.
National Benchmark Comparisons - Longitudinal Analysis 2005-2009
Western Illinois University’s comparative levels of achievement for each of these NSSE benchmarks are determined by assigning a value of 100 to the normative score attained by all participating institutions with our same Carnegie classification. WIU values exceeding the national Carnegie class average are above 100% and those WIU values not reaching the national average are below 100%.
Western’s comparative score is presented graphically below for each of the 5 effective educational practice benchmarks. Additional reports provide a tabular comparison for each of the considered elements of the five effective educational practice benchmarks, as well as present results by campus and college.
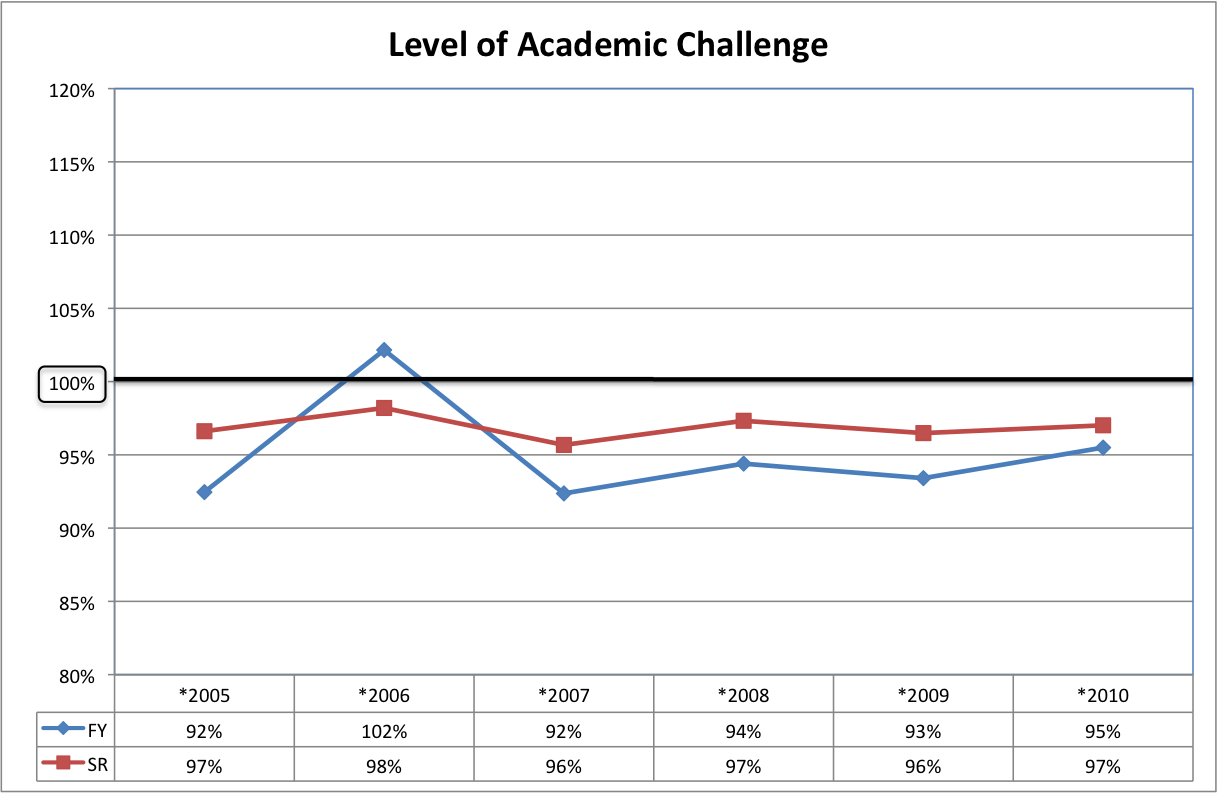
Level of Academic Challenge
Spring 2010 saw a virtually maintained Level of Academic Challenge for seniors, but freshmen reported an slight increase in Academic Challenge, narrowing the gap they had with their senior counterparts. However, except for the Spring 2006 peak at 102% for freshmen, Western is still challenged to increase its Level of Academic Challenge to at least meet the national benchmark of 100%.
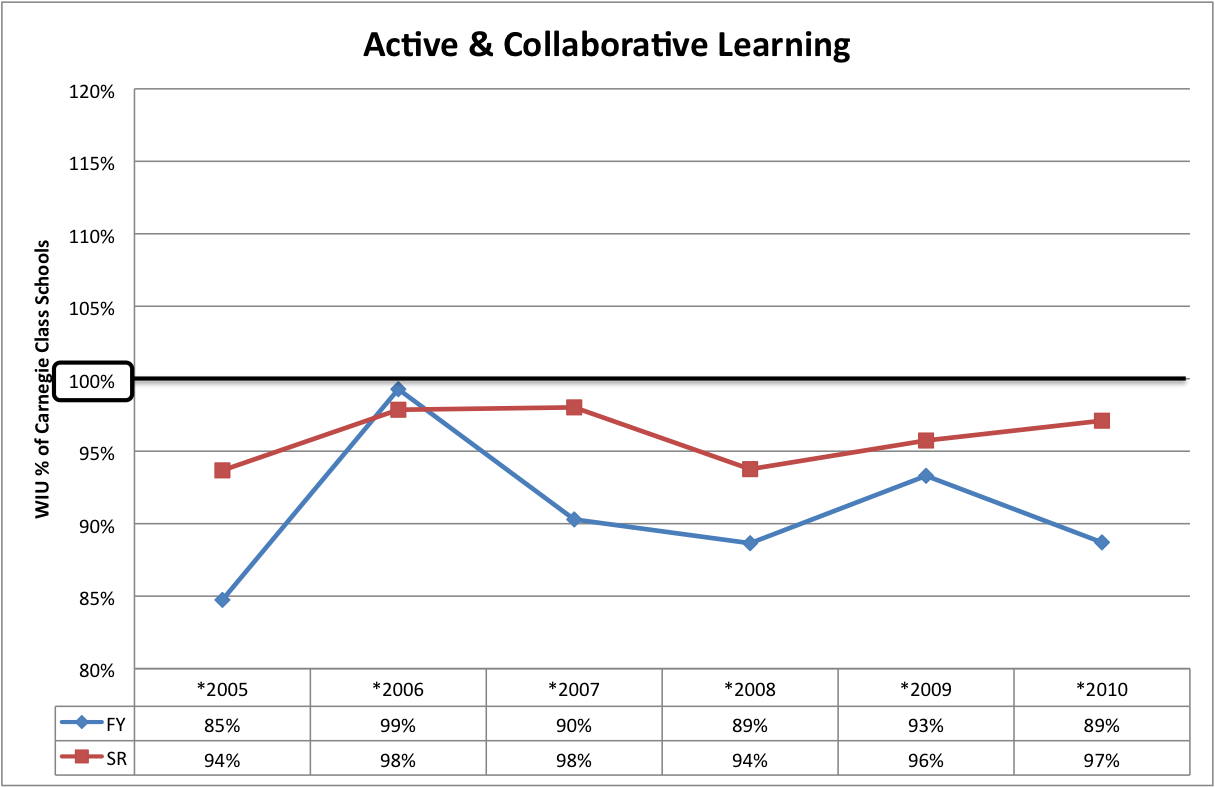
Active and Collaborative Learning
Spring 2010 an increase in Active & Collaborative Learning for seniors, but a decrease in Active & Collaborative Learning for freshmen, despite the continuation of the First Year Experience Program. Western is still challenged to increase its Active & Collaborative Learning to at least meet the national benchmark of 100&, having come closest in Spring 2006.
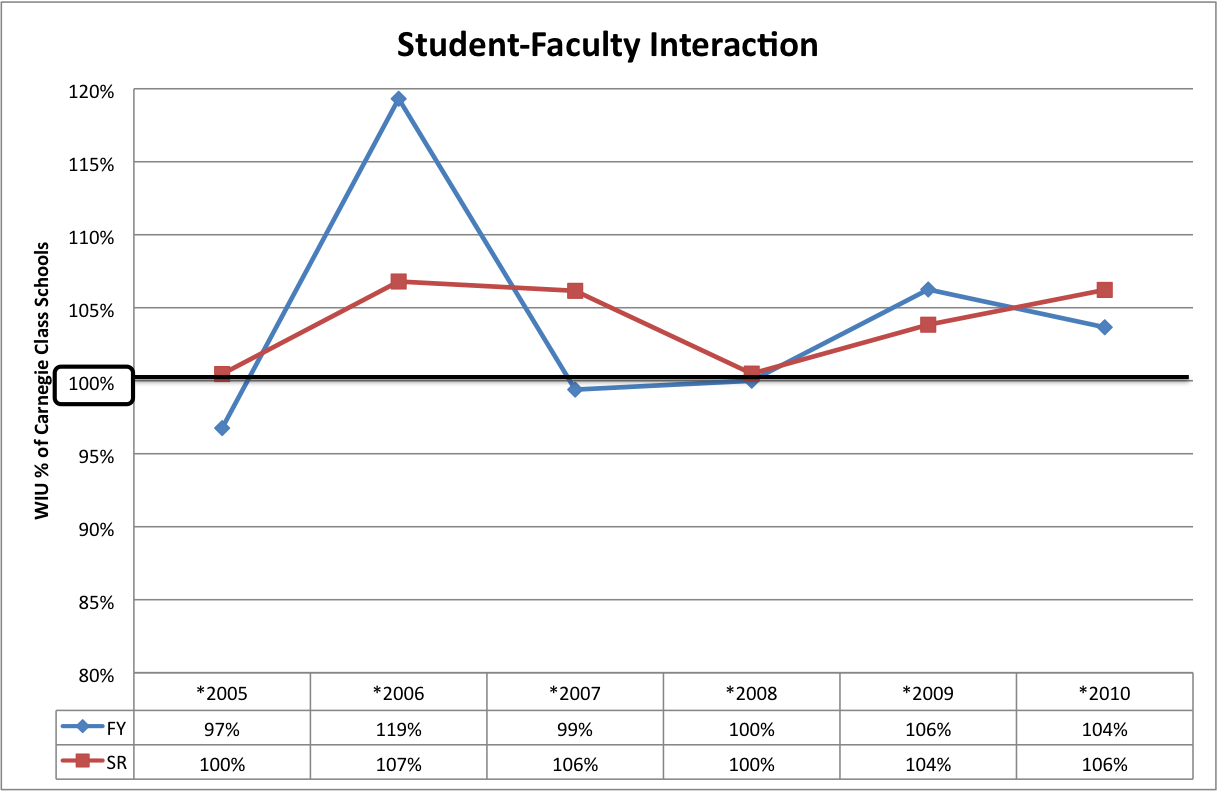
Student - Faculty Interaction
Following on the footsteps of Spring 2008 results which saw both Western's freshmen and seniors meet the national mean for all Carnegie Master's level institutions in terms of Student-Faculty Interaction, Spring 2009 saw both groups exceed the national average. This trend continued again for Spring 2010, with seniors increasing further, although freshmen declined somewhat. This is critical evidence of Western's strong commitment to Student-Faculty Interaction as a critical component in its Higher Values in Higher Education strategic plan. While the Spring 2010 benchmarks of 104% for freshmen and 106% for seniors do not quite reach the peak seen in Spring 2006, efforts to reverse the decline to just equal the national benchmark seen in Spring 2008 were successful and suggest continued growth.
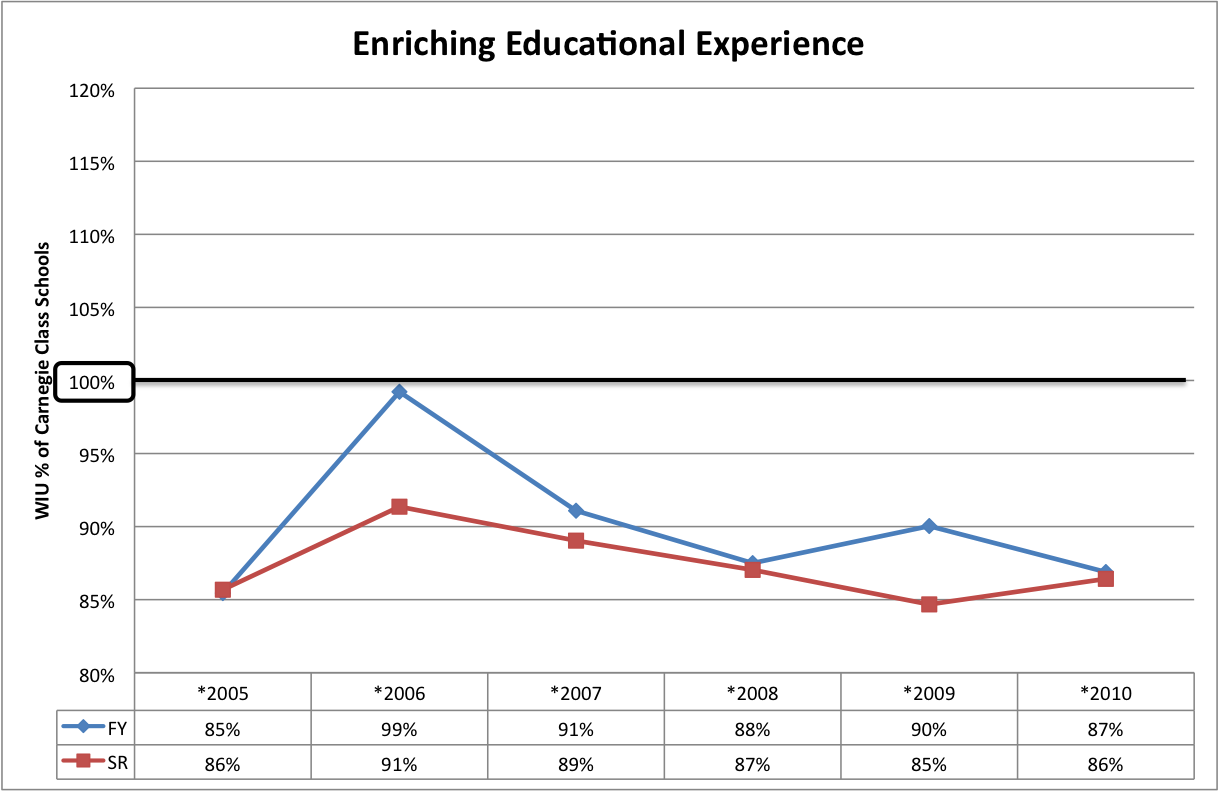
Enriching Educational Experience
Although seniors in Spring 2010 saw some improvement, there was a continued overall decline terms Enriching Educational Experience. Western clearly is continue to struggle in its efforts to provide students with an Enriching Educational Experience, and has not yet reached the national average despite ongoing initiatives to address this concern. This situation will continue to be monitored as Western seeks to at least meet the national benchmark of 100% for all of the NSSE benchmarks.
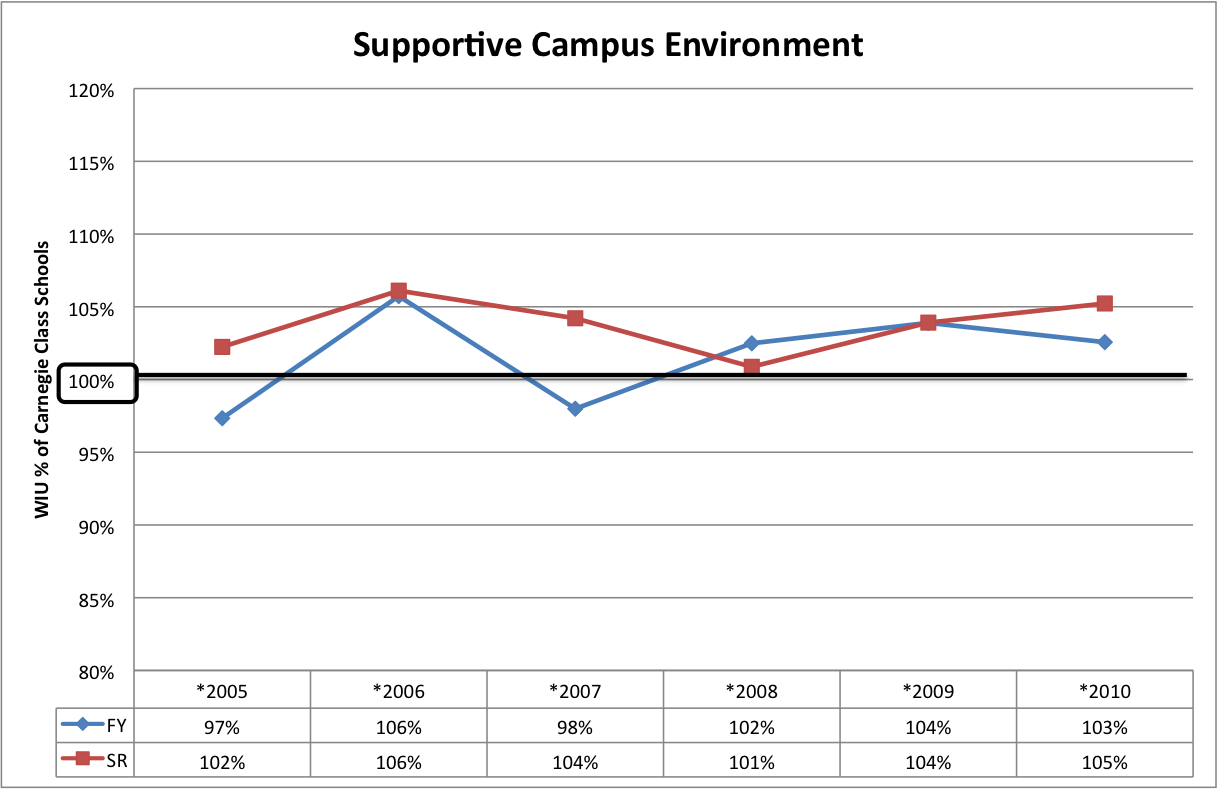
Supportive Campus Environment
With the exception of freshmen in Spring 2005 and Spring 2007, Western has consistently exceeded the NSSE national benchmark in terms of Supportive Campus Environment. Spring 2010proved no exception, and in fact continued improvement for seniors achieving 105% of the national benchmark, just short of the peak seen in Spring 2006. As with Student-Faculty Interaction, Western is committed to maintain the high level of success seen in providing a Supportive Campus Environment, striving to well exceed the national average.
In-Depth Analysis
A more in-depth analysis providing the individual components that comprise each of the 5 NSSE benchmarks of effective educational practices is provided below in PDF format.
- NSSE 2005-2010 Trend Report by Benchmark Component
- NSSE 2005-2010 Trend Report for Seniors by Campus
- NSSE 2005-2010 Trend Report by College
Connect with us: